 Insights into poverty and inequality - 4
There is a Parliamentary briefing paper published in Sept 2017 which analyses income inequality in the UK.
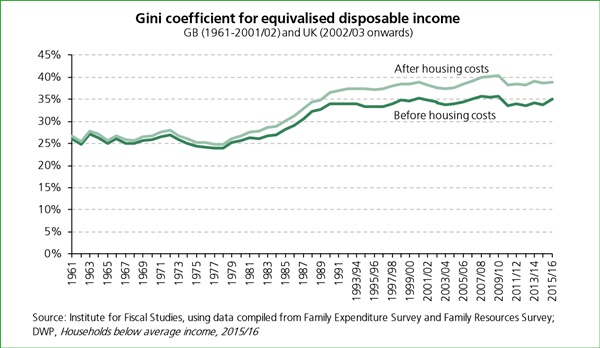
One standard measure of inequality is called the “Gini coefficient”. That is defined such that if the Gini coefficient is 0 everyone has the same wealth, whilst if it is 1 then one person has all the wealth and all others have none.
The paper reports that the UK became a much more equal nation during the post-war years. The data available shows that the share of income going to the top 10% of the population fell over the 40 years to 1979, from 34.6% in 1938 to 21% in 1979, while the share going to the bottom 10% rose slightly. It other words, the middle grew.
Since 1979 this process of narrowing inequality has reversed. As shown in the graph below, inequality rose over the 1980s, reaching a peak in 1990. Since the early 1990s, inequality, as shown by the Gini coefficient, has stayed relatively level. In other words, although there is inequality there has not been a large increase in recent years.
(I'm not saying that something shouldn't be done about the level of the Gini coefficient - just reporting the trend. However if you look below at possible reasons, you will see that this could prove complicated).
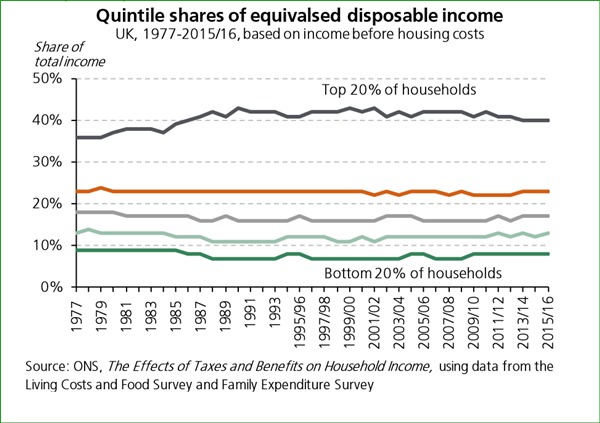
An alternative way of looking at inequality is to examine the share of all income going to different groups. In 2015/16, 42% of total disposable household income (before housing costs) in the UK went to the 20% of individuals with the highest household incomes, while 8% went to the bottom 20% (based on the Family Resources Survey). This has remained relatively the same since 1987.
The UK is not alone in seeing rises in income inequality. Most industrialised countries saw increases in inequality between the mid 1980s and the late 2000s, although English speaking countries like the United States, the UK, Australia and New Zealand have higher inequality than most continental European countries. Many reasons are suggested for such inequality. Some of these are:
-
Demographics. Older people, an increasing proportion of the population, have higher earning power than the young who are just developing their careers.
-
Family breakdown and rise of single income families
-
Better education with some skills demanding a premium
-
Globalisation - entrepreneurs can build a product and scale it globally very quickly - think Apple, Microsoft, Airbnb.
-
Trade liberalisation
-
Automation
-
Changes in government tax and welfare policy
-
Changes in employment patterns - service jobs, gig economy, multiple careers
-
Decline of old industries - creating deprived regions that give rise to issues of mobility.
Some will see these as opportunities, others as threats but there are success stories. From the Forbes list of British billionaires in 2017, in third comes James Ratcliffe (son of a joiner), in fourth the Livingstone brothers (sons of a dentist), in fifth Joe Lewis (son of a caterer), seventh the Barclay Brothers (sons of a travelling salesman), and ninth Laurence Graff (son of a suit maker). So half of the ten richest Britons were not born into money.
Retweet about this article:
Geoff Knott, 27/02/2018